Science
Off-target risk,predicted before trials.
Faster, cheaper, and more precise: predict why a candidate would fail before the money is spent — traditional programs find out after.
4–6 weeks
to a de-risked computational lead · Epitorix estimate
Two paths to a candidate
Same target. The same question, asked earlier.
The difference is when you learn a molecule will fail: after 3–5 years and $5–10M, or after 4–6 weeks and up to $100K of in-silico design and de-risking.
up to65×
faster from target to candidate
4–6 weeks versus 3–5 years, to a candidate ready for preclinical testing
up to100×
lower cost from target to candidate
up to $100K versus $5–10M, to a candidate ready for preclinical testing
Traditional approach
3–5 years
from target to a development candidate
$5–10M
cost to a development candidate
- Preclinical development
- Clinical trials begin
- Toxicity discovered late
Epitorix
4–6 weeks
from target to a de-risked computational lead
up to$100K
cost to a de-risked computational lead
- Predict biodistribution & PK
- Identify organ & cell-type risk
- Optimize candidate before clinic
Epitorix estimates. ‘Preclinical’ means a designed, ranked and de-risked candidate ready to enter preclinical testing; in vitro and in vivo studies, GLP toxicology, GMP manufacturing and regulatory review follow before any first-in-human study.
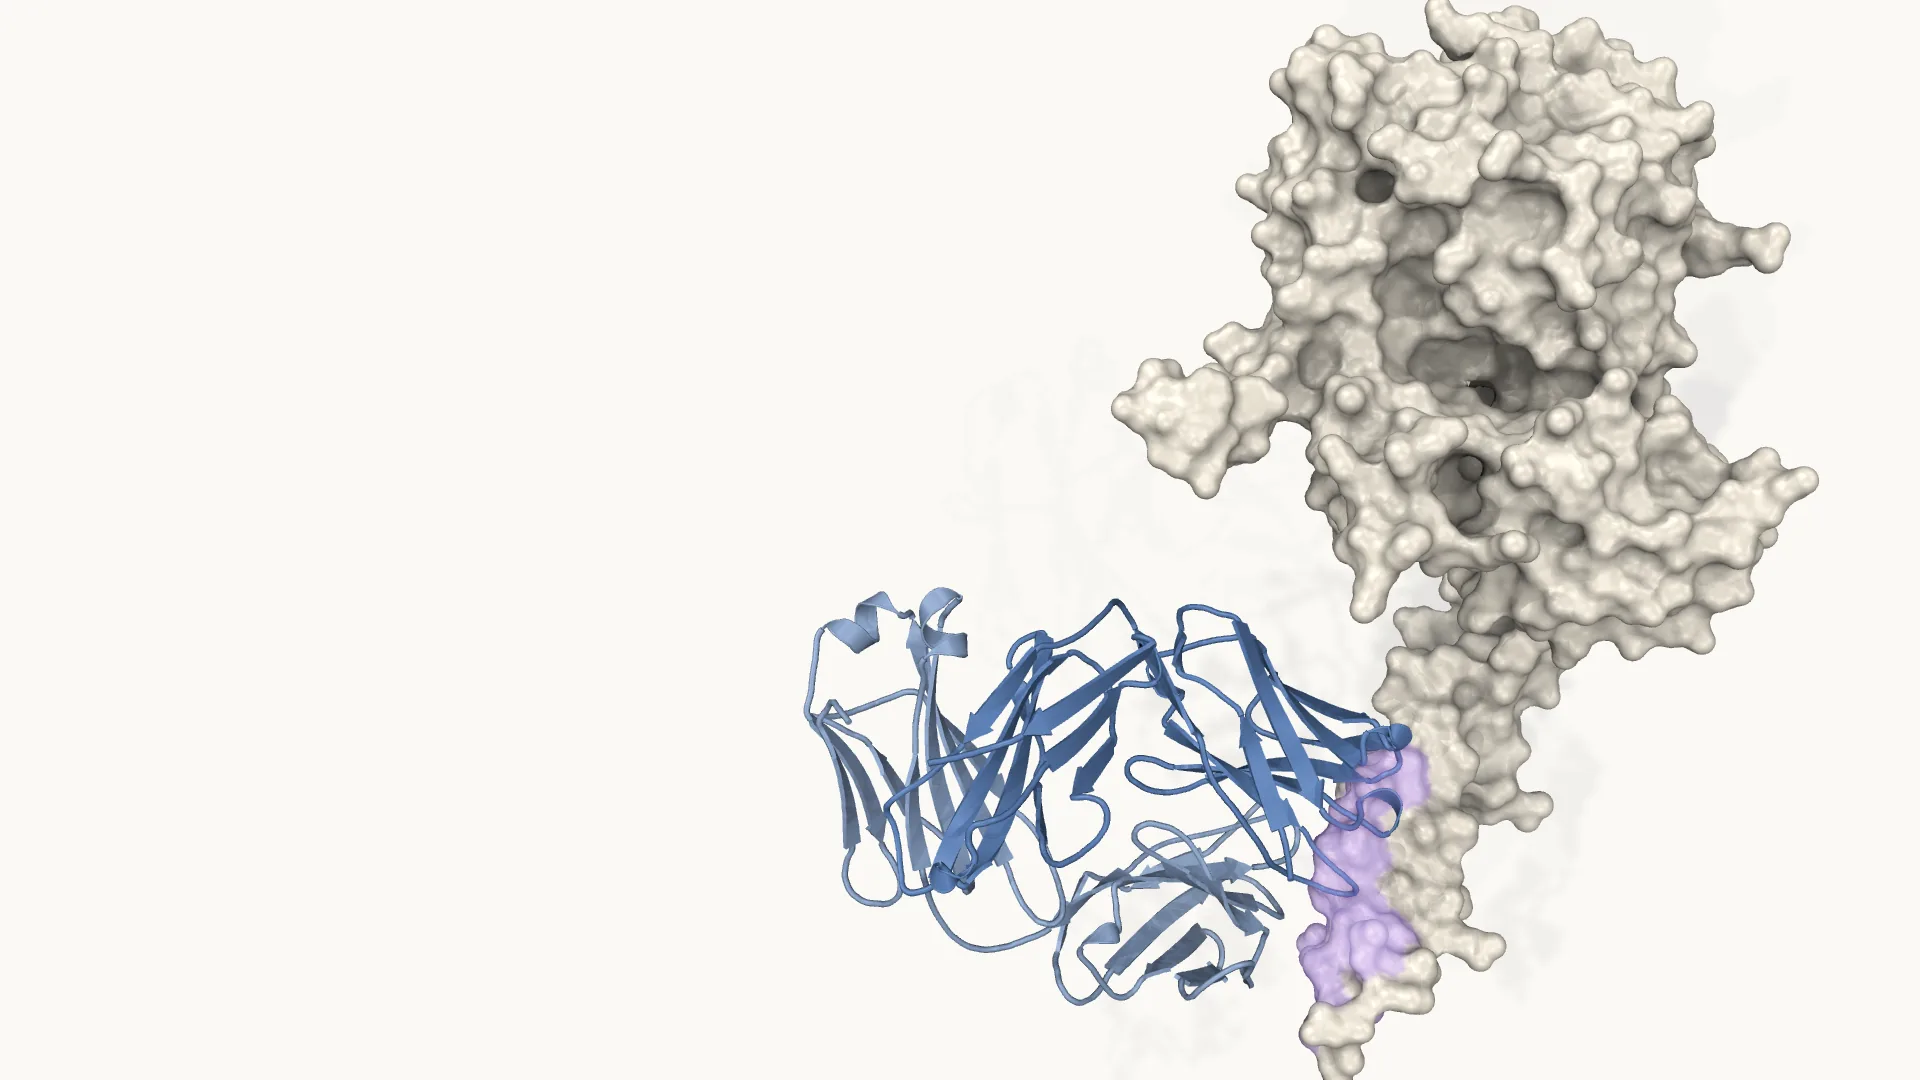
How the models work together
Design, de-risk, advance.
The same models design the candidate, predict where it goes and what it hits, and rank what to test next. Every product runs on them.
- Target — Design (EPiQ · Xenoclea).
- Binding-site analysis — Design (EPiQ · Xenoclea).
- Generation — Design (EPiQ · Xenoclea). ~10,000: about 10,000 site- and target-specific candidates.
- Affinity ranking — Design (EPiQ · Xenoclea). ~1,000/s: about 1,000 molecules per second, ranked by predicted Kd; Pearson R 0.84 for peptides in internal benchmarks.
- Optimization — Design (EPiQ · Xenoclea).
- Off-target — De-risk (PharmPhax · PharmacoLaw). ~1 hour: the whole proteome in about one hour, over 90% recall on known off-target interactions.
- Biodistribution & organ risk — De-risk (PharmPhax · PharmacoLaw). up to 93%: organ, cell-type and biodistribution risk; up to 93% accuracy detecting reported development and safety liabilities in retrospective analyses of radiopharmaceuticals with documented clinical outcomes.
- In vitro — Advance (Therapeutic Pipeline). 10+ labs: Epi-labs — over 10 labs across the United States.
- In vivo validation — Advance (Therapeutic Pipeline).
- Translational & regulatory — Advance (Therapeutic Pipeline).
- Clinic — Advance (Therapeutic Pipeline).

Head to head
No display library. No million compounds. A shortlist worth testing.
Site-specific ligand discovery has meant mRNA or phage display and libraries of millions of compounds. Epitorix's re-ranking model returns a shortlist ordered by confidence — the candidates most worth taking to the bench first.
- Display librarymillions of compounds · months
- Epitorix re-rankinga shortlist · confidence-ordered
92.4%
Small molecules
78–100%
Peptides
canonical 81% · macrocyclic 78% · non-canonical 100%
78%
Mini-proteins
86%
Antibodies
73%
RNA ligands
56%
DNA ligands
Hit rate = shortlisted candidates confirmed to bind at < 10 nM · Epitorix re-ranking model · internal benchmark
The re-ranking model runs inside EPiQ and Xenoclea.
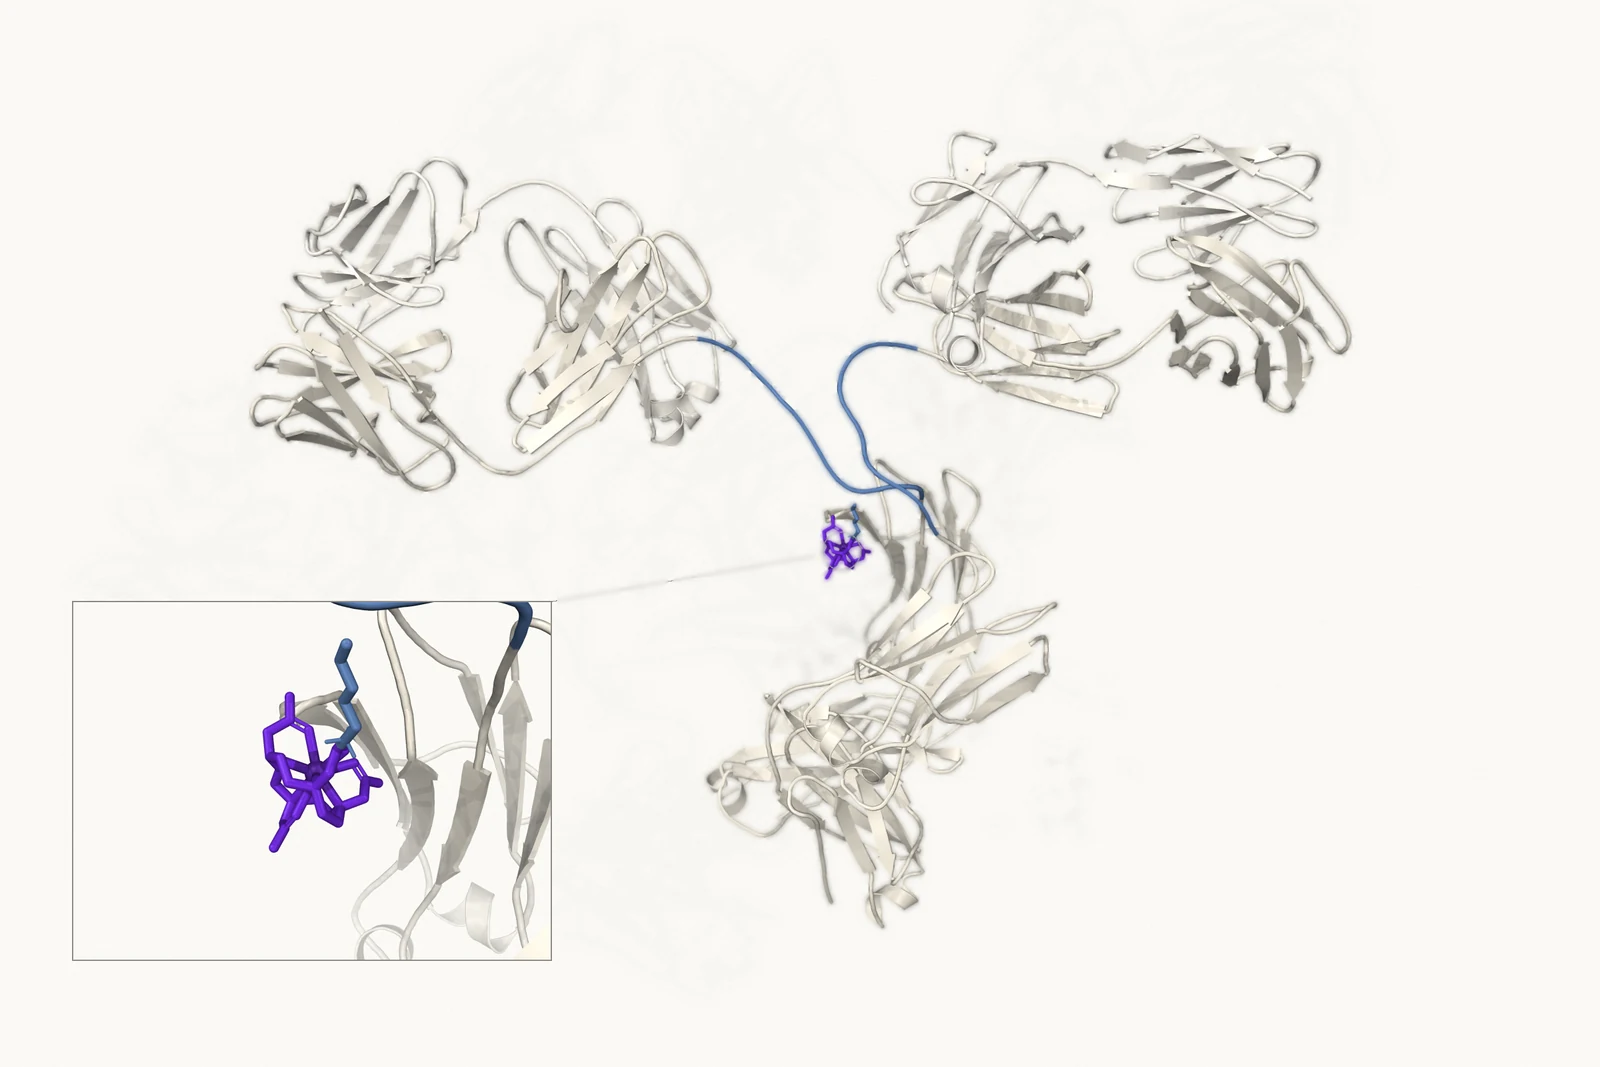
Our in-house models
We are not just combining published models. We have our own.
Epitorix's in-house models are its own architectures, trained on data we generate ourselves and validated at the bench — for peptides, antibodies, nanobodies and mini-proteins. They run beside published models in EPiQ — 30+ models in all, selected per target rather than defaulted to one — and every product runs on them.
100%
of designs taken to the bench bound their target
In internal benchmarks; the number of designs, targets and the assay threshold are not yet published.
30+
models in EPiQ, published and in-house
0.84
Pearson R, predicted vs measured pKd — peptides
in internal benchmarks
Targeted generation
Ten thousand candidates, one binding site.
Targeted generation is de novo design against one chosen binding site: new backbones and sequences sampled by generative models rather than selected from a library. Phage and mRNA display take months and return noise. Epitorix generates ~10,000 site- and target-specific candidates — about six months saved, success rates up about 60% versus display libraries, in internal benchmarks.
~10,000
site- and target-specific candidates
~6 months
saved generating high-quality candidates
versus display libraries
~60%
success-rate increase
versus display libraries, in internal benchmarks
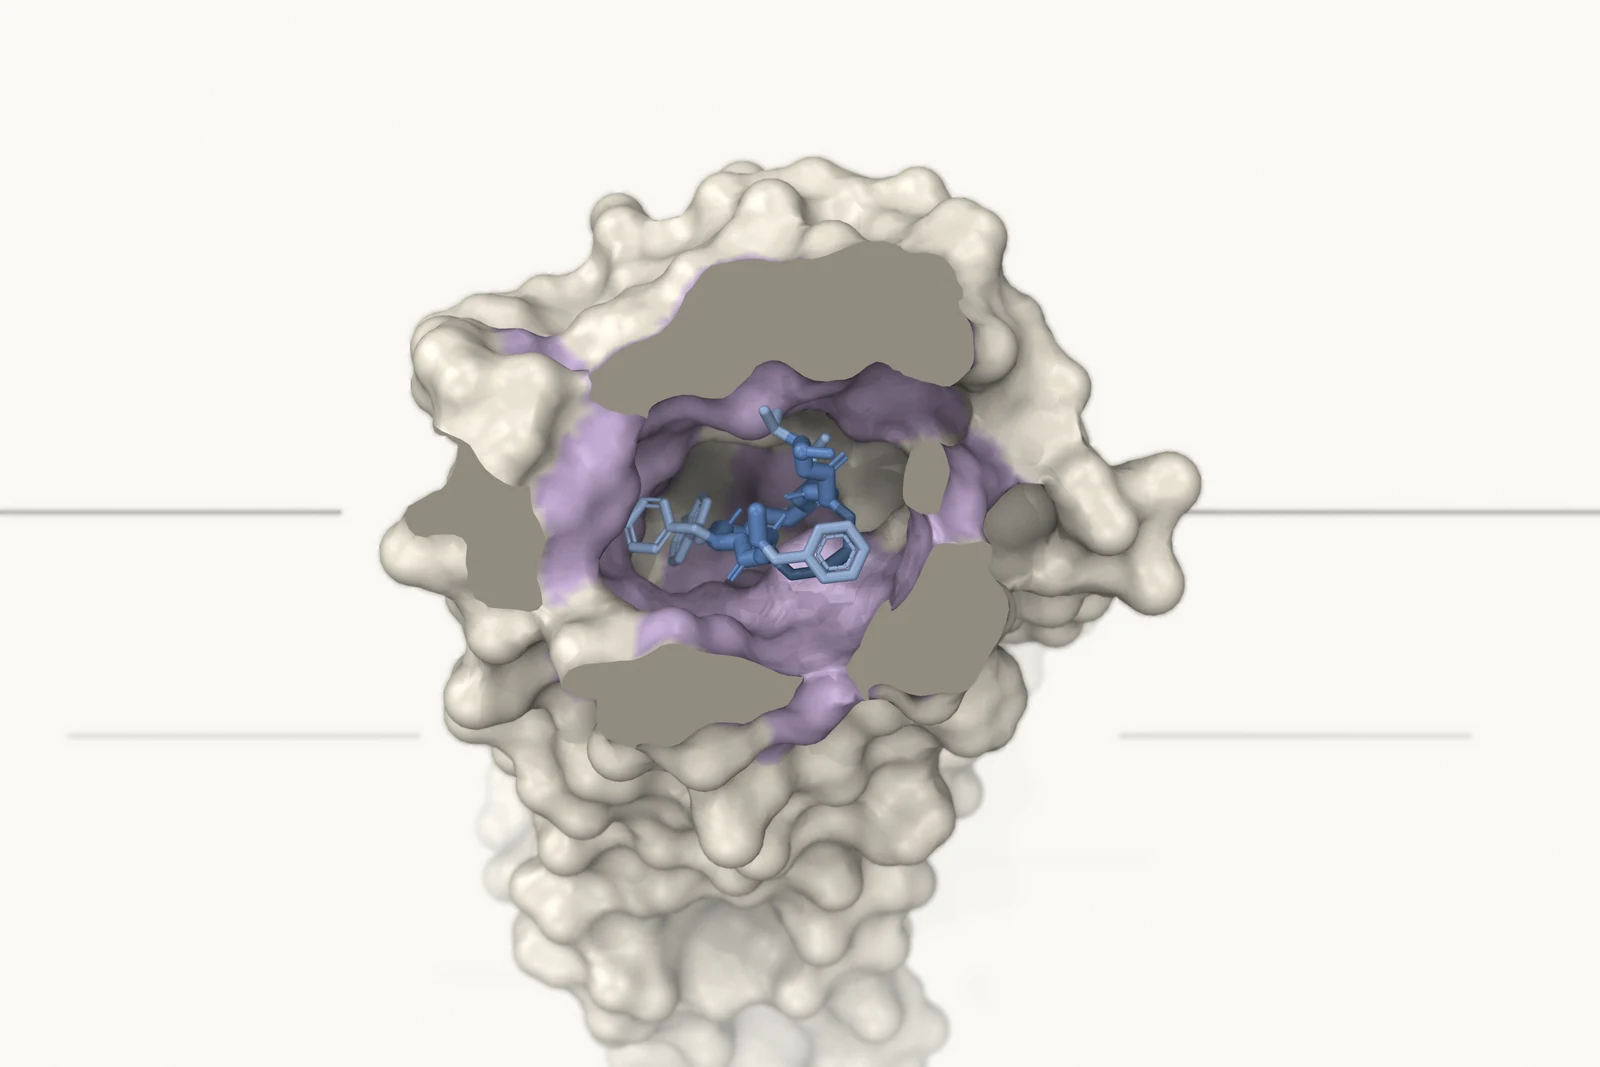
Off-target prediction
Off-target binding, proteome-wide, in about an hour.
Off-target prediction is the screening of a candidate against proteins other than its intended target, to find the binding that causes toxicity in healthy tissue. A microarray is limited by what is on it. Epitorix screens binders, peptides and small molecules against the whole proteome computationally, in about an hour — over 90% recall on known off-target interactions.
>90%
recall on known off-target interactions
in retrospective analyses
- NCAM1
- SSTR1
- CXCR4
- ATRNL1
- PRKG1
- BCL2
- FXYD2
- PLPP1
Affinity ranking
Binding affinity, Kd at scale.
Binding affinity is how tightly a ligand holds its target, measured as the dissociation constant Kd: lower is tighter. SPR and BLI measure it in months; molecular dynamics and FEP+ take hours per ligand pair. Epitorix predicts Kd at about 1,000 molecules per second — Pearson R 0.84 for peptides, 0.70 for small molecules, in internal benchmarks.
0.70
Pearson R, predicted vs measured pKd — small molecules
in internal benchmarks
~1,000
molecules per second
>80%
of true top ligands recovered
from 100 generated, in internal benchmarks
Biodistribution and organ risk
Biodistribution and organ risk, before trials.
Biodistribution is where a radiopharmaceutical goes in the body and how much reaches each organ over time — with PK and PD, which healthy tissues pay for the dose. Toxicity often surfaces after trials begin. Epitorix predicts biodistribution, organ and cell-type risk, PK and PD first — detecting previously reported liabilities with up to 93% accuracy in retrospective analyses.
PharmPhax, the report built on thisBiodistribution and dosimetry, explained
up to93%
accuracy detecting reported development and safety liabilities
in retrospective analyses of radiopharmaceuticals with documented clinical outcomes
- Salivary glandsLow
Salivary acinar cells
- LiverModerate
Hepatocytes
- KidneysHigh
Proximal tubular cells
- MarrowModerate
Hematopoietic stem & progenitor cells
Anterior view · schematic, not to scale · ink density = predicted risk for one candidateHighModerateLow
| Organ | Cell type | Predicted risk |
|---|---|---|
| Salivary glands | Salivary acinar cells | Low |
| Liver | Hepatocytes | Moderate |
| Kidneys | Proximal tubular cells | High |
| Marrow | Hematopoietic stem & progenitor cells | Moderate |
The same models run our own programs.
The four programs now in vivo were designed with the models on this page.
Figures from retrospective analyses and internal benchmarks; a preprint describing the evaluation is forthcoming.

Contact
Bring us a target.
A target to design against, a candidate to de-risk, or the pipeline data.
Laboratory bench · liquid handler and assay plates